Voter Turnout Bucked the National Trend in Wisconsin
It grew in blue and red-leaning places alike
Voter turnout in Wisconsin this year was very high—among the highest ever in presidential elections in Wisconsin. Unofficial returns show 3,422,802 votes cast for president, up from 3,298,041 in 2020.[i]
About 125,000 more people voted in 2024 than 2020. Meanwhile, the state’s over-18 population grew by an estimated 56,000 between 2020 and 2023.[ii]
We won’t know the 2024 population estimate until sometime next month. If the over-18 population increase is fewer than 69,000, that will indicate that the share of adults voting in 2024 exceeded 2020, which was already an exceptional year.
The Wisconsin Elections Commission calculates that 72.9% of adults voted in 2020, which is the third highest rate since their data begins in 1948. In 1966, they estimate 72.0% voted and in 2004, 73.2%.[iii] Depending on the 2024 adult population estimate, the 2024 election will likely join this group of extremely high turnout elections where just shy of 3-in-4 adults participated.
Keep in mind that turnout as a share of the voting eligible population is even higher. Here are some estimates from the University of Florida Election Lab.
In 2024, the Election Lab estimates that 76.4% of eligible voters in Wisconsin cast a ballot, compared to 63.5% nationally. In 2020 it was probably 75.0% in Wisconsin, compared to 66.4% nationally. Turnout in Wisconsin is usually higher than US average, but this year the gap grew especially large. In 2020, turnout was 8.6 points higher in Wisconsin, growing to 12.9 points higher in 2024.
The true voter turnout rate can only be estimated because the denominator (actually eligible citizens) is unknown. At least in a month or two, we’ll have more recent data for the state adult population, from which we can further refine these estimates of the eligible share.
Estimates for the adult population of counties and municipalities will become available later in 2025. The kind of granular data needed to estimate ward-level adult population turnout rates won’t be available until the 2030 census.
The absence of high-quality data will not prevent the creation of turnout statistics, nor should they, necessarily. We cannot wait for the 2030 census to begin figuring out which voters were inspired by the last campaign and which weren’t. My point in elaborating these difficulties is to warn you that the first turnout statistics you see will not be the final word on the matter.
Here is what the limited data we do have can tell us about voter turnout around Wisconsin.
· The number of votes cast for president increased in 71 of 72 counties. Only tiny Menominee was the exception (18 fewer votes cast).
· The number of votes cast grew by more than the 2020-2023 increase in the adult population in 65 of 72 counties. The 7 counties where vote change lagged adult population growth are Bayfield, Vilas, Forest, Ozaukee, Menominee, Ashland, and Burnett.
· In Milwaukee County, the number of votes cast grew by 4,346, despite the adult population falling by about 11,900 between 2020 and 2023.
· In Dane County, the number of votes cast grew by 21,153, compared with an adult population increase of about 15,600 between 2020 and 2023.
· In Waukesha County, the number of votes cast grew by 7,756, while the adult population grew by an estimated 6,900 between 2020 and 2023.
The Census Bureau’s Population Estimate Program doesn’t provide adult population estimates for individual municipalities, so we’re stuck with total population estimates.
· In the City of Milwaukee, the number of votes cast grew by 560 votes, while the total population fell by about 15,800 between 2020 and 2023.
· In the City of Madison, the number of votes cast grew by 11,740, while the total population grew by an estimated 5,100 between 2020 and 2023.
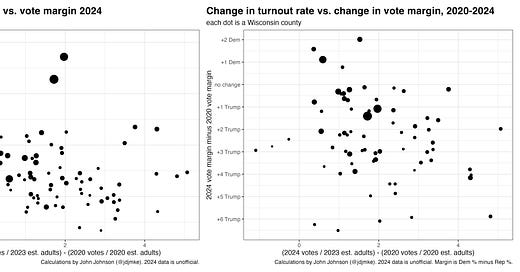
It is not the case that turnout fell in Democratic-leaning communities and increased in Republican ones. There is no correlation between a county’s change in turnout and the share of the vote received by Donald Trump. There may be a slight correlation between the increase in turnout and the increase in Trump’s share of the vote relative to 2020.
High turnout helped Trump because a group of infrequent voters showed up and disproportionately supported him. These “low propensity” voters were spread evenly across the state, contributing to Wisconsin’s small but remarkably uniform 1.5-point swing toward Trump.
Note: This post was updated to include a new analysis of the correlation between turnout and partisan vote share.
[i] The number of votes cast for president is slightly lower than the total number of ballots cast, which I have not collected. In 2020, 10,764 voters turned in a ballot but declined to vote in the presidential contest.
[ii] These numbers are from the Census Bureau’s Population Estimates Program and are estimated for July 1st of each respective year. The estimates for July 1, 2024 will be released in December.
[iii] The WEC numbers use total ballots cast as their denominator (not presidential votes), and they use a slightly different estimate of the over-18 population. Their estimate comes from the Wisconsin Department of Administration which uses a somewhat different methodology and calculates their annual estimates for a different date than the federal Population Estimates Program.


