Both Donald Trump and Tammy Baldwin translated their slender statewide victories into hypothetical 1-seat majorities in the Wisconsin State Assembly, each winning a majority of the vote in 50 of the chamber’s 99 districts.
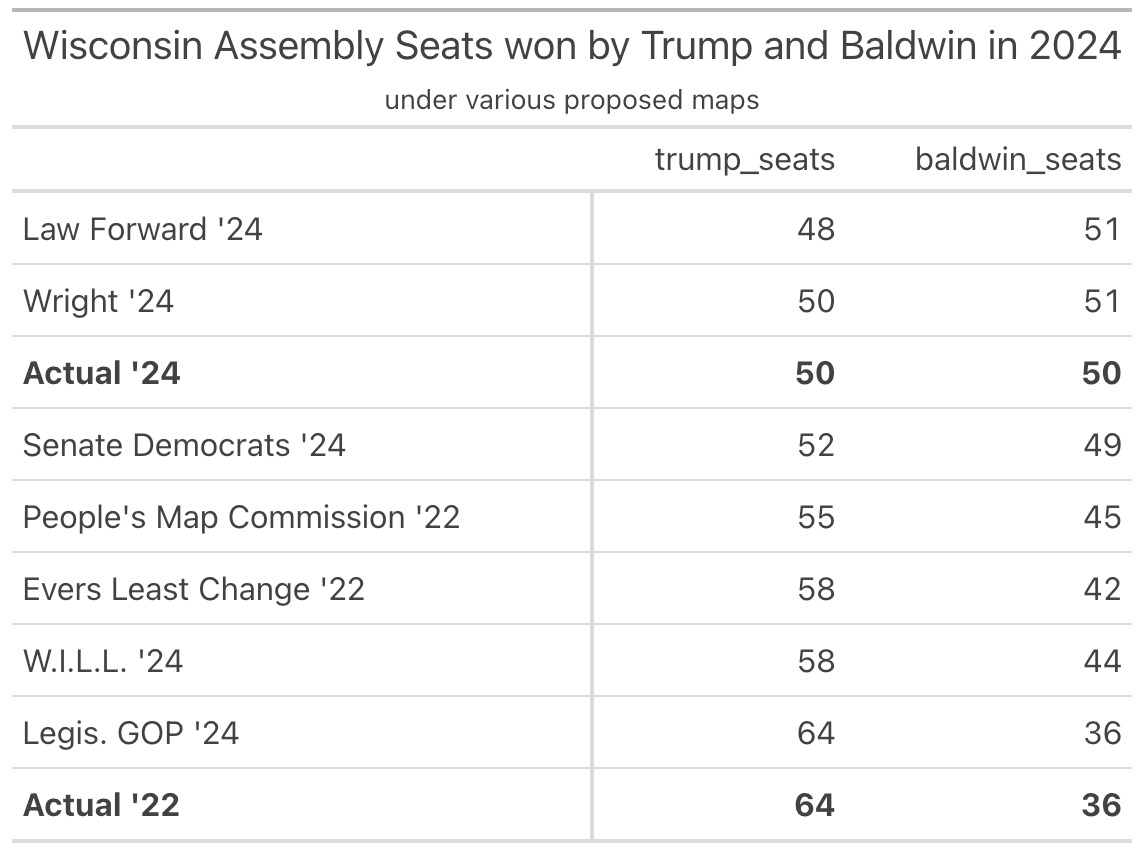
Under the map used in the 2022 election, I estimate that Trump would have won a majority in 64 districts and Baldwin in just 36.[i] The table below shows the outcome in various maps proposed during the 2022 and 2024 redistricting disputes.
Although drawn by Gov. Tony Evers, the current maps are slightly less favorable to Assembly Democrats than the plans submitted to the Wisconsin Supreme Court by the progressive firm Law Forward and the Wright Petitioners.
However, the current map is far more favorable to Democrats than the map drawn by Evers’ own People’s Map Commission. That group, which used a nonpartisan criteria, proposed a map under which Trump would’ve won 55 seats.
Of course, actual Democratic candidates only won 45 Assembly seats, falling 4 seats short of the total won by Kamala Harris and 5 short of Baldwin. This is because Republican Assembly candidates were (with exceptions) more popular than Donald Trump.
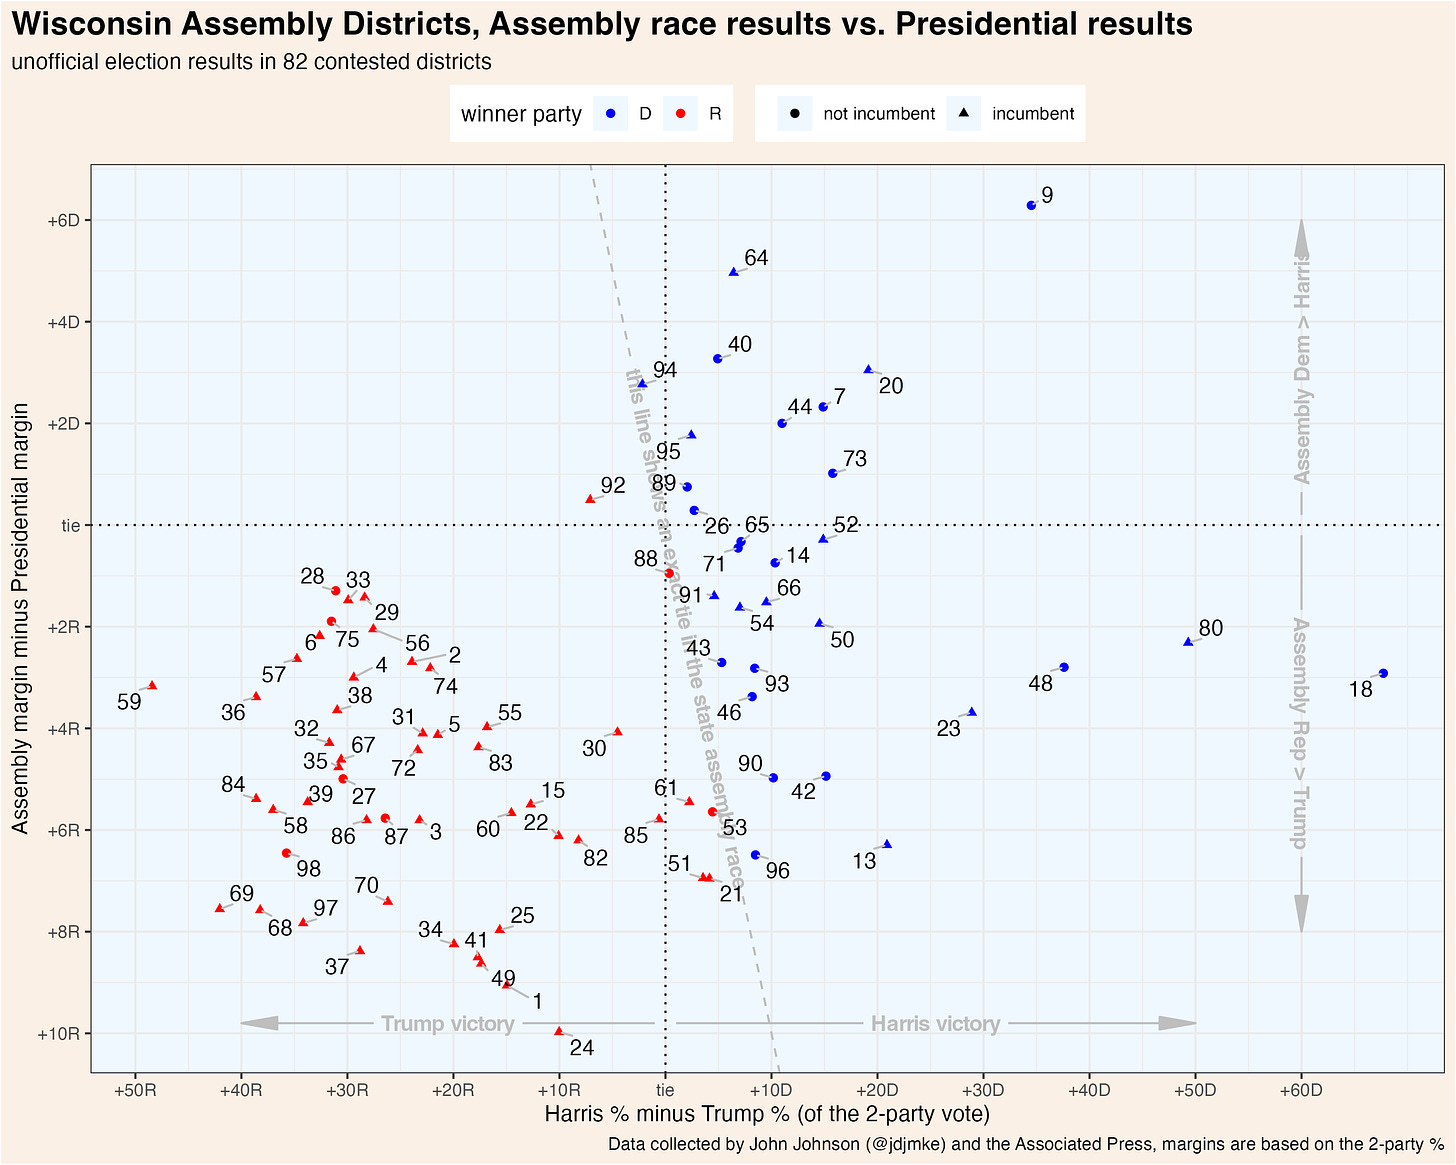
The graph below shows how each Assembly race compared with the outcome of the presidential race in that district.
Five GOP Assembly candidates won districts that Trump lost. They are as follows:
88th (Green Bay area): Benjamin Franklin won 50.3% of the two party vote, compared to Trump’s 49.8%
61st (Southwestern Milwaukee suburbs): Bob Donovan won 51.6% to Trump’s 48.9%.
53rd (Neenah/Menasha): Dean Kaufert won 50.6% to Trump’s 47.8%.
51st (Dodgeville area): Todd Novak won 51.7% to Trump’s 48.2%.
21st (Southern Milwaukee suburbs): Jessie Rodriguez won 51.4% to Trump’s 47.9%.
One Democratic candidate carried a seat that Trump won. Longtime incumbent Steve Doyle carried the 94th district (north of La Crosse) with 50.3% of the two-party vote, compared with 51.1% for Trump.
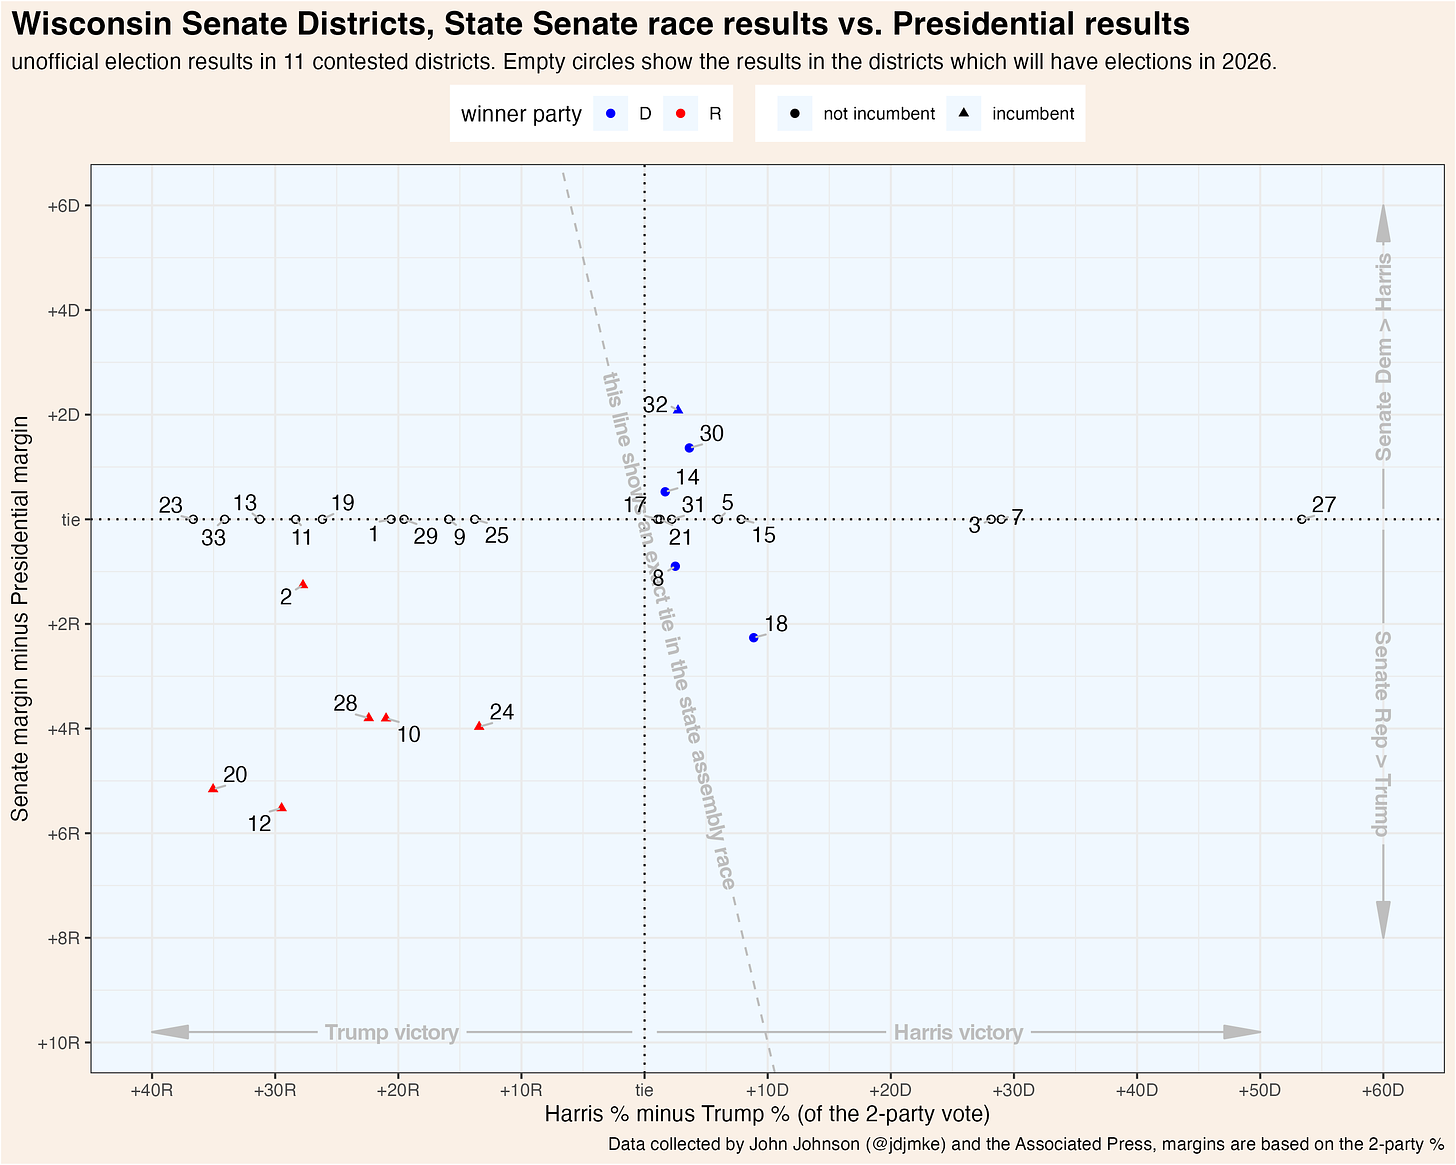
There were no split results in the State Senate. The closest race came in the 8th district, covering Milwaukee’s northern suburbs. Here, Democrat Jodi Habush Sinykin won 50.8% of the two-party vote, compared with Harris’ 51.2%.
This graphic also shows the 17 odd-numbered districts where elections will be held in 2026. They are visualized as empty circles, plotted at the zero point on the y-axis.
Of the likely competitive seats in 2026, Harris and Baldwin both won all of them.
· The 31st (Eau Claire) is currently held by a Democratic incumbent. Harris won it by 2.2 points, Baldwin by 4.8.
· The 17th (Southwestern Wisconsin) is held by a Republican. Harris won it by 1.1 points, Baldwin by 4.7.
· The 21st (southern Milwaukee metro) is held by a Republican. Harris won it by 1.3 points, Baldwin by 2.3.
· The 5th (western Milwaukee metro) is held by a Republican. This is the rare district where Harris outperformed Baldwin. Harris won it by 6 points and Baldwin by 5.
Democrats will need to win 3 of the 4 districts listed above to win a majority of the State Senate in 2026.
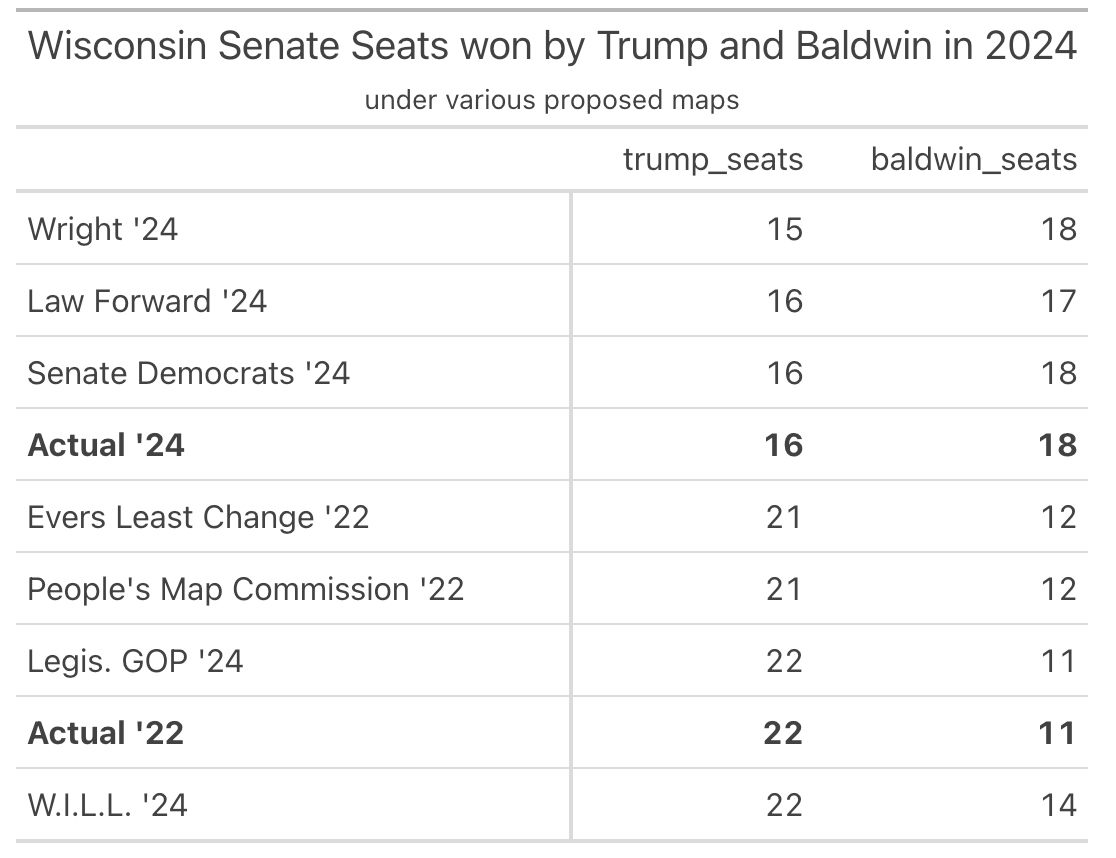
As the careful reader may have noticed, the current State Senate map actually has a structural advantage for Democrats. Despite losing the state by about a point, Kamala Harris won a majority of the vote in 18/33 Senate districts.
This table shows the number of senate districts won by Trump and Baldwin under selected alternative map proposals. Again, the difference is striking.
Under the map used in 2022, Trump’s narrow victory in 2024 was enough to win a supermajority of senate districts. Under the new maps, he wins fewer than half.
Under the nonpartisan People’s Map Commission, he would’ve won 21 of 33 seats.
Two common stories about the 2024 election are (1) that the election reflects a global anti-incumbent wave, and (2) that it was a reflection more of enthusiasm for Donald Trump than Republicans generally. Regarding the latter point, Wisconsin GOP strategist Bill McCoshen has argued, “This was a Trump wave, not a red wave. And Republicans should be very careful how they interpret the results of this.”
There is good evidence in support of both those perspectives. It’s true that incumbent parties—left, right, and center—have lost elections across both hemispheres. Donald Trump has enjoyed electoral success by turning out infrequent voters who often stay home during elections when Trump isn’t on the ballot.
Still, the data from Wisconsin’s state legislative elections show the limits of both those narratives. Of the 82 contested state assembly races, Donald Trump was more popular than the GOP assembly candidate in just 12. While incumbent parties and executives may be unpopular, some degree of incumbency advantage still clearly endures. In a future newsletter, I’ll share statistics about exactly how much incumbency advantaged both parties in 2024.
Data Note
This post uses unofficial 2024 election results. The results of state legislative races are taken from the Associated Press. I collected presidential and US Senate results from each voting tabulation district in the state (available here). To calculate the results of these races within each state legislative district, I intersected the centers of voting tabulation district polygons with the polygons defining state legislative districts.
Access source data for this post from this GitHub Repository.
Note: A previous version of this post incorrectly described the 88th district and showed the D minus R margin of the vote including third parties. Those errors have been corrected.
[i] I calculated this by first allocating unofficial 2024 reporting unit results into census blocks. I disaggregated reporting units to blocks using allocation weights derived from registered voter addresses in the L2 Voter File. Then, I used the block assignment files for each plan to aggregate votes.


Fantastic data.